Network Data Flow Analysis

PRTG network sun
PRTG network sun

As more and more broadcast facilities are moving toward IP data for all types of data transfer including digitized audio, video, telephony, documents, email, applications, and programs.  Managing an IP network is becoming more and more important.  In most broadcast facilities, Ethernet-based IP networks have been the normal operating infrastructure for email, printing, file sharing, common programs, file storage, and other office functions for many years.  Either directly or indirectly, most broadcast engineers have some degree of experience with networking.

With many more IP-based audio consoles, routing systems, STL’s and other equipment coming online, understanding IP networking is becoming a critical skill set.  Eventually, all distribution of content will transition to IP-based systems and the current network of terrestrial broadcast transmitters will be switched off.

The difference between an ordinary office network and an AoIP (Audio over IP) or VoIP network is transfer consistency.  In an office network, data transfer is generally bursty; somebody moves a file or requests an HTTP page, etc.  Data is transferred quickly from point A to point B, then the network goes back to its mostly quiescent state. In the AoIP environment, the data transfer is steady state and the data volume is high.  That is to say, once a session is started, it is expected to say active 24/7 for the foreseeable future. In this situation, any small error or design flaw, which may not be noticed on an office network can cause great problems on an AoIP network.  The absolute worst kind of problem is intermittent failure.

Monitoring and analyzing data flow on a network can be a critical part of troubleshooting and network system administration.  Data flow analysis can discover and pinpoint problems such as:

  • Design flaws, infrastructure bottlenecks and data choke points
  • Worms, viruses, and other malware
  • Abusive or unauthorized use
  • Quality of Service (QoS) issues

Cisco defines flow as the following:

A unidirectional stream of packets between a given source and destination—both defined by a network-layer IP address and transport-layer source and destination port numbers. Specifically, a flow is identified as the combination of the following seven key fields:

  • Source IP address
  • Destination IP address
  • Source port number
  • Destination port number
  • Layer 3 protocol type
  • ToS byte
  • Input logical interface

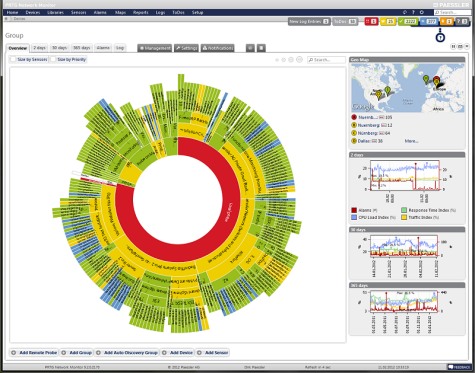
Packet sniffers such as Wire Shark can do this, but there are far better and easier ways to look at data flow.  Network monitoring tools such as Paessler PRTG can give great insight as to what is going on with a network.  PRTG uses SNMP (Simple Network Management Protocol) on a host machine to run the server core and at least one other host to be used as a sensor.  There are instructions on how to run it as a virtual machine on a windows server, which would be the proper way to implement the server, in my opinion.

For small to medium installations, the freeware version may be all that is needed.  For larger networks and major market installations, one of the lower-cost paid versions may be required.

Computer guys…

Some guy posted this picture on Reddit:

Small Office network

In the comments, he gets blasted for being too neat and using wire ties.  I know a lot of IT guys that are not very neat with their work and document nothing.  This is a big problem in the industry and does not, contrary to popular belief, promote job security.  I have walked into some very messy situations in wiring closets and rack rooms over the years.  My solution is always the same; run some temporary wires for critical machines/functions, then get out the big wire cutters and start chopping.

Graphical Network Simulator

I have been working with GNS3 (Graphical Network Simulator) in some of my classes.  It is a fine tool with which one can build simulated computer networks using various routers and switches.  The software program itself is free, however, the Cisco IOS images are not included and must be found elsewhere due to copyright issues.  This detail is a bit of a pain, but not too bad.  Once the program is set up and the appropriate IOS images are loaded, the console functions exactly like whatever router is being simulated.  This includes running whichever terminal program is preferred, e.g. hyperthermia, putty, or if using the Linux version, x-term, etc.

GNS3 screen shot, topology and router console
GNS3 screenshot, topology, and router console

The advantages to this over something like Cisco’s Packet Tracer program are many.  In Packet Tracer, certain functions are locked out and generally there is only one acceptable way to complete any given task.  With GNS3, the IOS is fully functional, which means that experimentation and failure are available to play with.  Failure is a great way to learn things in any hands-on environment.  The advantage of virtual failure is that only you know about it.

For real-world applications, this means that router and switch configurations can be created, tested, and tuned ahead of time and then loaded into working devices, saving downtime and potentially handfuls of hair.

A few things about using GNS3, the PC idle tuning is required.  Each instance of IOS assumes that the entire processor is available to use, thus starting several routers can work a PC’s processor to 100% and windows will never fully recover.  Secondly, when starting each router, wait 10 to 20 seconds before starting another one.  Again, this has to do with the way IOS uses processors.  Also, to save time, store the IOS image as a decompressed file.  This saves quite a bit of time on startup.  Finally, do not forget to copy the running config to startup-config.  Even though GNS3 says it is saving the router configs, it does not save the running config unless you issue the copy run start command, just like a real router.

Wireshark; what is it good for

Wireshark is a packet protocol analyzer that is free for download and runs on Windows, Linux, BSD, OS X, and Solaris.  In the evolving broadcasting studio, computer networks are the backbone of the facility. Not just on the office side of the house, but also on the broadcast origination side as well. Today, almost everyone uses some type of computer automation system running on a network. In addition, new technologies such as AoIP consoles, VoIP phone systems, audio and video routing, remote control, off-site monitoring, audio processing, etc continue to develop.  Because of this, more and more broadcast engineering work is falling into the computer and networking realm.

Like anything else, networks can fail.  Failure modes can originate from both the physical side, e.g. wiring, connectors, patch bays, network interface cards or the software/protocol side.  Being able to diagnose problems quickly and take remedial action is important.  On the networking side, if a physical problem has been ruled out, then the problem exists with a protocol.  That is where Wireshark becomes useful; it takes the guesswork out of networking protocol troubleshooting.

Wireshark packet protocol analyzer has the following features (from their website):

  • Deep inspection of hundreds of protocols, more are in development
  • Live capture and offline analysis
  • Standard three-pane packet browser
  • Versions available for Windows, Linux, OS X, Solaris, FreeBSD, NetBSD, and other OS
  • Captured network data can be browsed via a GUI, or via the TTY-mode TShark utility
  • Filtering by protocol, IP address, MAC address, frame type, sequence number, etc
  • VoIP analysis
  • Read/write many different capture file formats: tcpdump (libpcap), Pcap NG, Catapult DCT2000, Cisco Secure IDS iplog, Microsoft Network Monitor, Network General Sniffer® (compressed and uncompressed), Sniffer® Pro, and NetXray®, Network Instruments Observer, NetScreen snoop, Novell LANalyzer, RADCOM WAN/LAN Analyzer, Shomiti/Finisar Surveyor, Tektronix K12xx, Visual Networks Visual UpTime, WildPackets EtherPeek/TokenPeek/AiroPeek, and others
  • Capture files compressed with gzip can be decompressed on the fly
  • Live data can be read from Ethernet, IEEE 802.11, PPP/HDLC, ATM, Bluetooth, USB, Token Ring, Frame Relay, FDDI, and others (depending on your platform)
  • Decryption support for many protocols, including IPsec, ISAKMP, Kerberos, SNMPv3, SSL/TLS, WEP, and WPA/WPA2
  • Coloring rules can be applied to the packet list for quick, intuitive analysis
  • Output can be exported to XML, PostScript®, CSV, or plain text

A few things to keep in mind with the physical connection.  Connecting a computer to a switch port will establish a collision domain between the switch port and the computer which is also called a network segment.  The computer NIC will see all traffic on that collision domain and all broadcast traffic on the network or sub-network that the switch is attached to.  If there is a suspected problem with a particular network segment, the Wireshark computer needs to join that collision domain.

Creating a network segment tap with a hub

This can be done most simply by installing Wireshark on the host in that domain. Alternatively, a hub can be used to add another host to the collision domain.  Or, if it is a managed switch, there may be a provision to send all traffic on the switch out of one designated port.  This is called ‘port mirroring’, ‘port monitoring’, ‘Roving Analysis’ (3Com), or ‘Switched Port Analyzer’ or ‘SPAN’ (Cisco).

Network diagram with managed switch

A quick tutorial on what to look for when using Wireshark, Part A:

Part B:

And briefly, that is how it is done.  There are many more videos on youtube and elsewhere if interested in learning more.