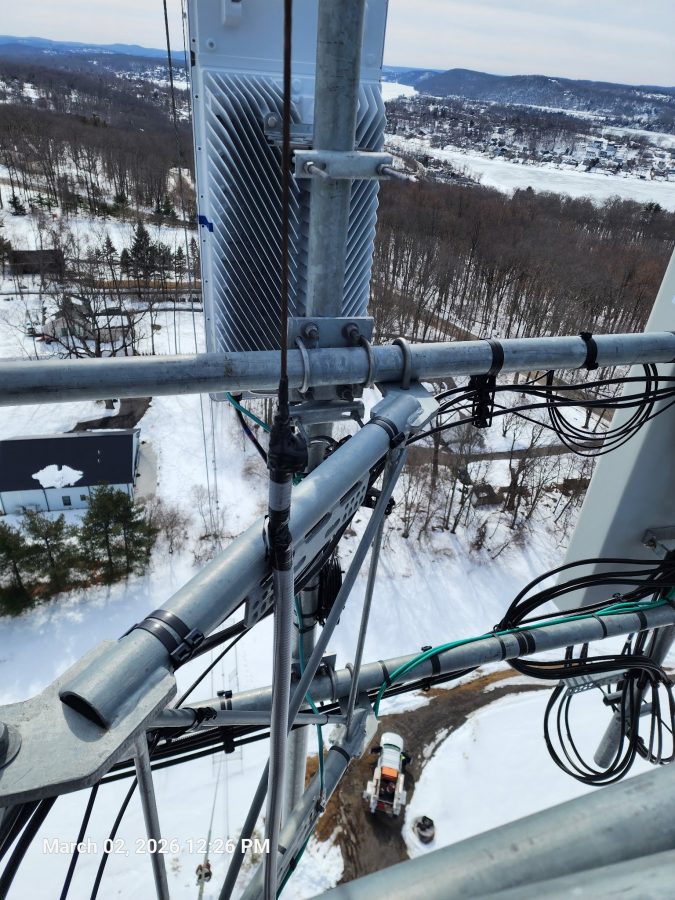
A story about skirted AM towers and Cellular carriers.
Skirted AM tower with cellular equipment
We take care of a few sites that have skirted AM towers with Cellular equipment installed. For the first few years, all was well. The cell carriers put up their equipment under supervision and we made sure that the AM station’s antenna still was working when the were finished. At some point, things changed.
Stiff arm hitting skirt wire
It is a little bit hard to see because the camera is focused on the foreground and not the background, but the stiff arm from the cell carrier sector is shorting the skirt wire to the tower.
More often then not these days, tower crews show up unannounced and start working on the tower. I had a call from a client their station being off the air only to arrive on site and find a crew on the tower with the AM skirt grounded by a set of battery jumper cables. The ground crew said they kept getting shocked by the wire so they grounded it.
In other cases, they show up, do the work and leave before anybody notices. Then, at some point somebody checks the AM transmitter readings and sees a problem.
AM skirt wire, shorting against mounting bracket
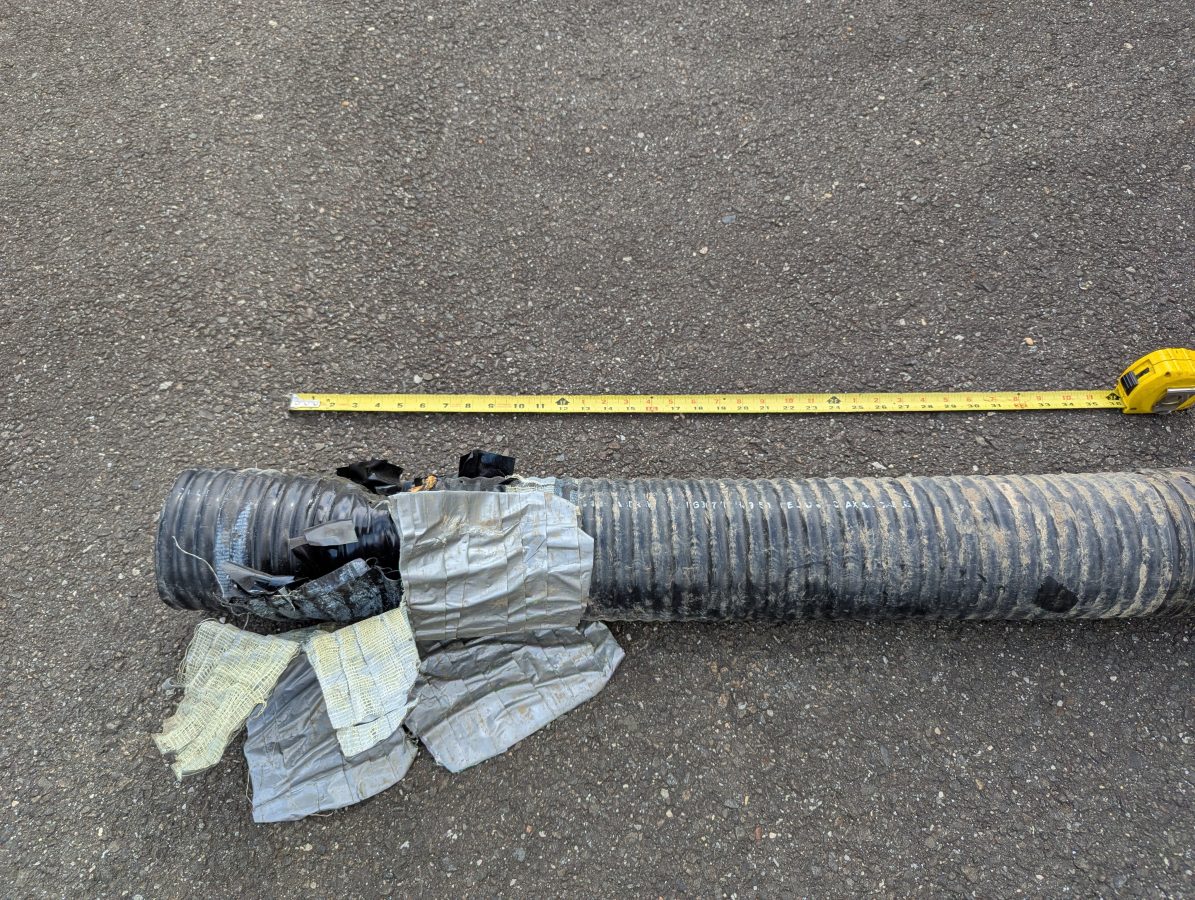
In another situation, the tower crew came and installed new equipment. They installed an insulating sleeve around the skirt wire (while the transmitter was on) but did not secure it well enough. The eventually, sleeve slipped down the wire and it shorted. No one, not even the tower owner, knew about the tower crew being on the tower.
AM skirt wire insulating sleeve
Same tower, the sleeve on this wire rotated around so that the opening was facing the stiff arm causing a large charred, melted plastic area.
These were repaired with some left over coax-seal and electrical tape. After this, I was able to retune the ATU using my network analyzer.
The only solution, it seems, is to put up more cameras with motion detection notification so when somebody shows up unannounced the station will at least know about it.
The ability to do a Distance to Fault Measurement can greatly speed up the troubleshooting of potential antenna and/or transmission line problems. DTF measurements take on one of two forms; Time Domain Reflectometry (TDR) and Frequency Domain Reflectrometry (FDR).
TDR is the traditional method of measuring Distance to Fault. The test equipment sends short DC pulses down the cable and measures any return loss or SWR. Energy reflected back toward the instrument will plotted based on the time difference between the transmitted signal and the received reflection, similar to RADAR. This works well finding opens or shorts, but may not see lesser faults that could still be causing problems.
Damaged six inch coax
FDR is now common in most field models of Vector Network Analyzers. An FDR sends a frequency sweep down the cable then uses an Inverse Fast Fourier Transform (FFT) function to convert the information into a time domain. FDR can more reliably detect smaller issues with cables such as kinks, sharp bends, water in the cable, poorly applied connectors, or bullet holes. The piece of dented cable above would not have given a large reflection on a TDR, but on an FDR it would show up very nicely.
Like a VNA, an FDR needs to be calibrated for the sweep frequencies in use. The frequency span or bandwidth of an FDR has a major role in DTF measurements. A wider span will result in more precise fault information, however, it will reduce the over all length that the instrument can test. For most broadcast RF applications, cable lengths are less than 670 meters (2200 feet). Many instruments will adjust the maximum distance automatically based on the chosen span and velocity factor.
For my equipment, a Siglent SVA 1032X, the maximum distance for any frequency span can be found with this formula:
Maximum Distance (meters) = 7.86 x 10⁴ x Velocity Factor/Span (MHz)
Thus, to get best resolution sweeping a cable that is 670 meters long with a velocity factor of 86%: 7.68 x 10,000 x .86 / 95 MHz = 695 Meters maximum distance.
The resolution for any frequency span can be calculated with the following formula:
In this case, the resolution would be +/- 1.35 meters. For shorter cable lengths a larger span can be used for better resolution.
My preference is to center the sweep frequency around the channel or frequency of the system under test.
To use a DTF function, a few inputs are needed:
The velocity factor of the transmission line
Cable attenuation for the swept frequency in dB/Meter
The approximate length of the line under test
The cable velocity factor and attenuation can be obtained from the manufacturer’s data sheet. Keep in mind that the manufacturer’s data is an estimation. These are usually pretty close to the actual number, but may vary due to tight bends in the cable, any splices, transitions to different cable, etc.
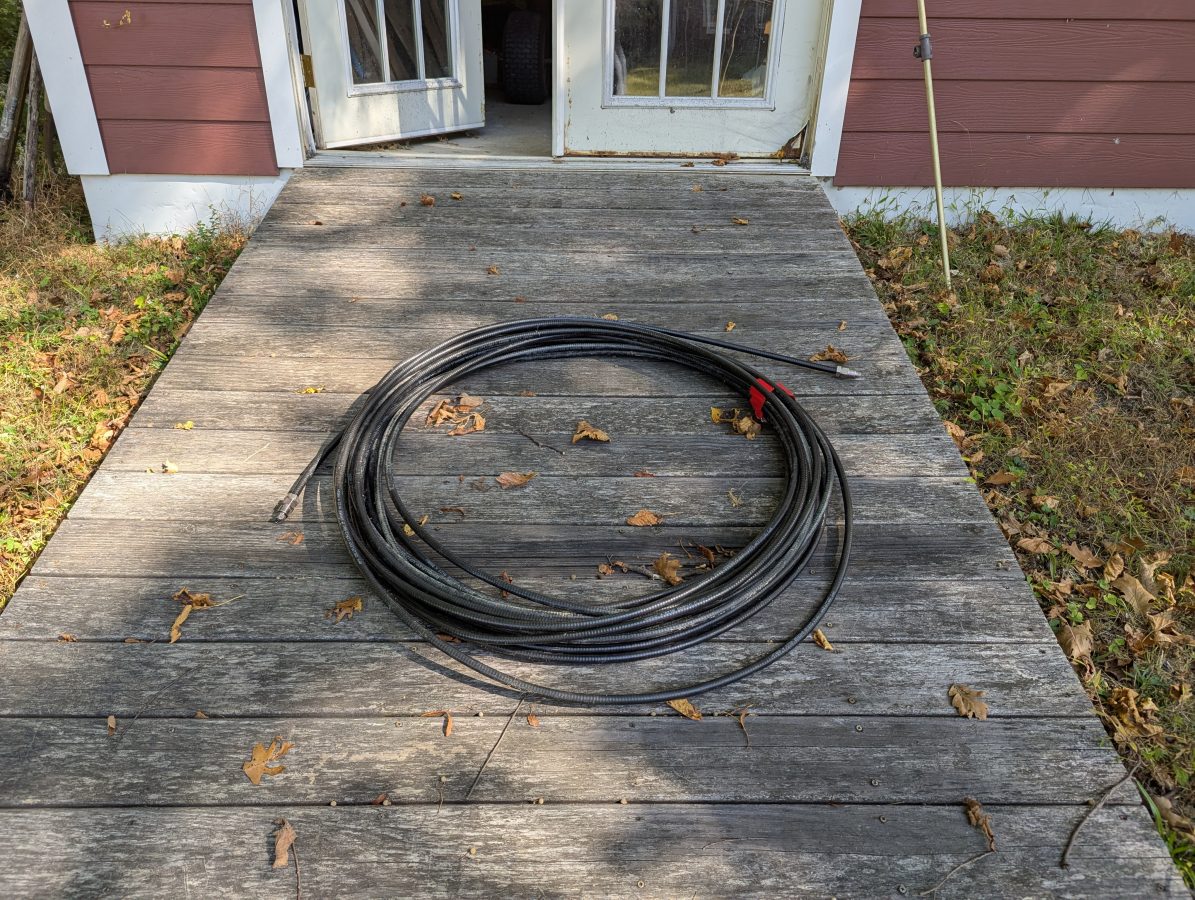
Cable to test
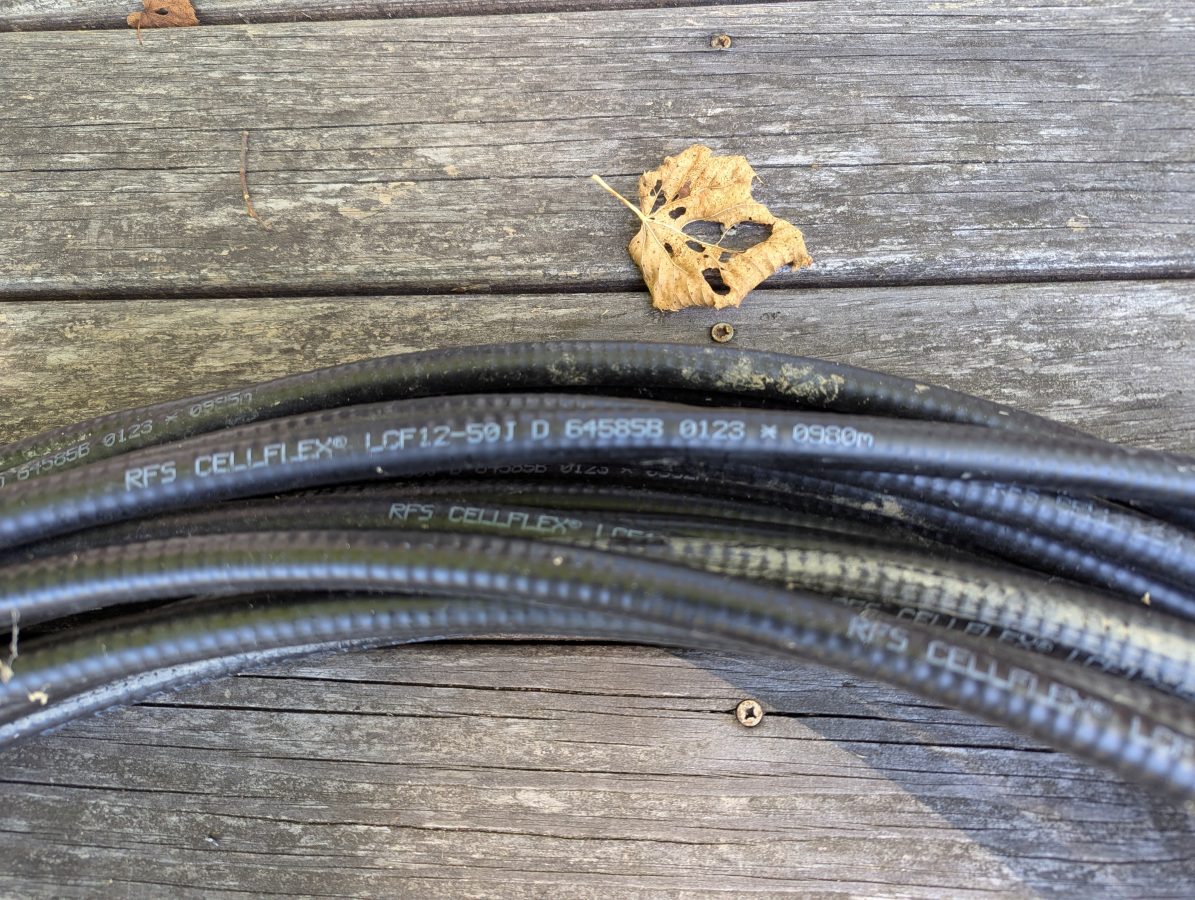
I had this used 1/2 inch RFS LCF12 50J cable in the barn, left over from project. Fortunately this is newer cable and it had the length marked out in meters. The beginning number was 0980 meters, the end was 1021 meters. Each meter marking has an asterisk before the number. I used a meter stick to measure out the distance between the asterisks and they are exactly one meter apart. I then measured the distance between the asterisk and the connector on each and ended up with 1.49 meters (4.9 feet) additional length, making the total length 42.49 meters (139.4 feet). The manufacture’s specification on velocity factor is 0.87 or 87% of the speed of light.
Manufacture’s markings
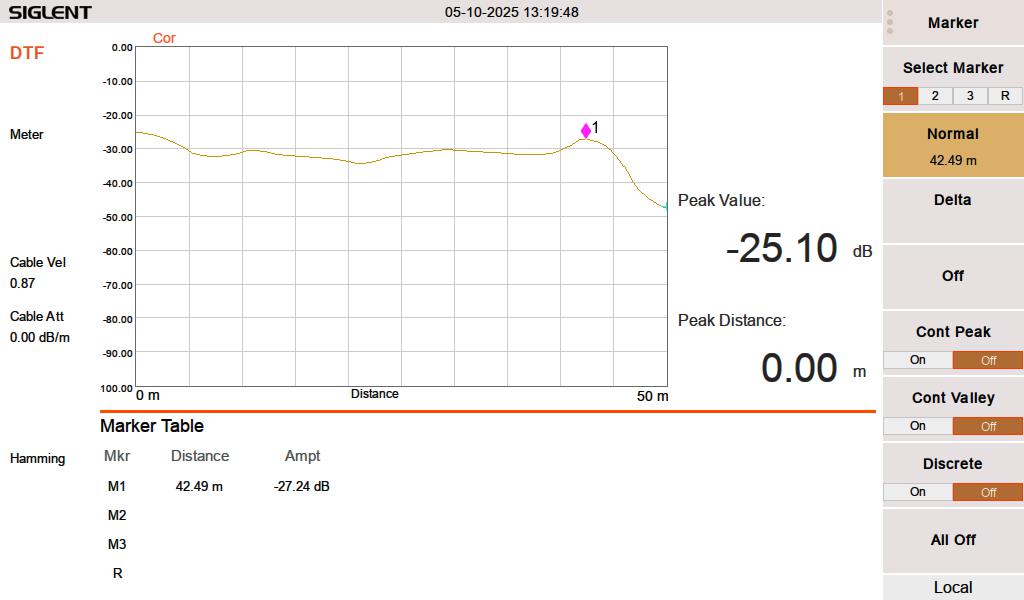
When I test this line with a 50 termination, it looks like this:
FDR DTF, 50 ohm termination at 42.49 meters
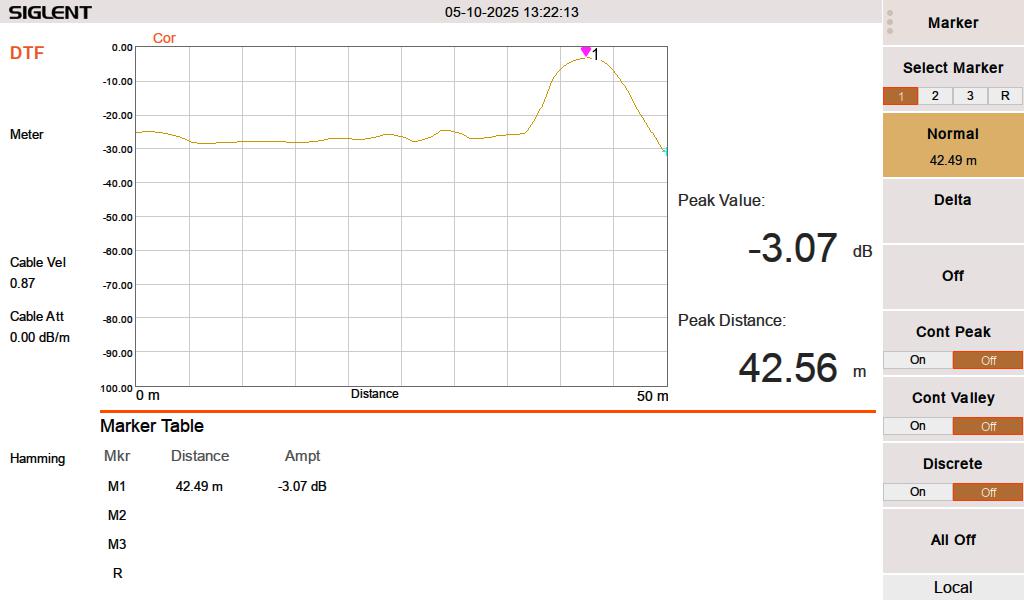
When I test the line either open or shorted, it looks like this:
FDR DTF, cable shorted at 42.49 meters
I swept the cable at HF frequencies (3-30 MHz) since I think that is what this is going to be used for. At 3 MHz, the cable has a loss of approximately 0.003 dB per meter, which is inconsequential for this test. The velocity factor of 0.87 is pretty close. A longer run might indicate that it is actually 0.875 or 0.88.
Velocity factor and cable impedance are very important when using the Moment of Methods (MOM) system for AM antenna work. In that situation, both need to be obtained with a VNA for the FCC application.
The best practice is to sweep into a terminated line. In an AM system, a termination can most often be applied at the ATU input J plug. Sweeping into an antenna is possible, however there are several things that may lead to poor results. Most often, an FM antenna will look like a short on a DTF measurement. A UHF slot antenna will look open. In addition to that, the DTF measurement may be corrupted by any signals being received by the antenna while the system is under test.
I don’t know how many parts there should be in this series, five is a guess.
While some AM stations surrender their licenses to the FCC, others are undergoing needed repair work to stay on the air for a while longer.
WBEC-AM, Pittsfield, MA
WBEC-AM in Pittsfield Mass is the topic of today’s post. This station is Non-Directional day, Directional Night with a two-tower array. This site was built around 1956 when the station moved from Eagle Street, near downtown Pittsfield.
WBEC-FM backup antenna, mounted on WBEC-AM array
This Shively 4-bay antenna is the backup antenna for WBEC-FM. It is being replaced with a 3-bay antenna. The new antenna will serve W277CJ which is relocating from downtown and as a backup for WBEC-FM. A set of signal strength measurements for the nighttime directional array is required along each of the three monitor point radials before and after that work is completed.
The issue these days is the nighttime directional system, which is somewhat erratic when in use. The towers are 180 degrees tall with 35 degrees of top loading making the towers 215 degrees tall or just under 5/8 wavelength. As such both current and voltage are near maximum at the tower base, which makes them very sensitive to any changes at the base.
First, there was an issue with the tower lighting system. It seems that somewhere on the non-reference tower, the beacon conductor is shorted to the tower. When the tower lights are on, the loop current rises and falls in time with the beacon light. Because these are series excited towers, the fuse for the beacon does not blow, but the 60-cycle AC current does show up on the tower loop current reading. Rather than try to repair things on an almost 70-year-old tower light system, it was decided that both towers should get new LED lighting systems.
Next, mice chewed through several AC supply cables for the phasor at the base of tower #1. When switching from day to night patterns, some or all of the contactors would not move or get hung up between states taking the station off the air.
It is unfortunate that the phasor is at the base of one of the towers and the antenna monitor is back inside the building with the transmitter. It takes two people to make adjustments to the nighttime array.
The tower #1 ATU/phasor building is full of old unused equipment, a mouse haven. It also blocks access to several points that need to be sealed up to keep mice from getting in in the first place.
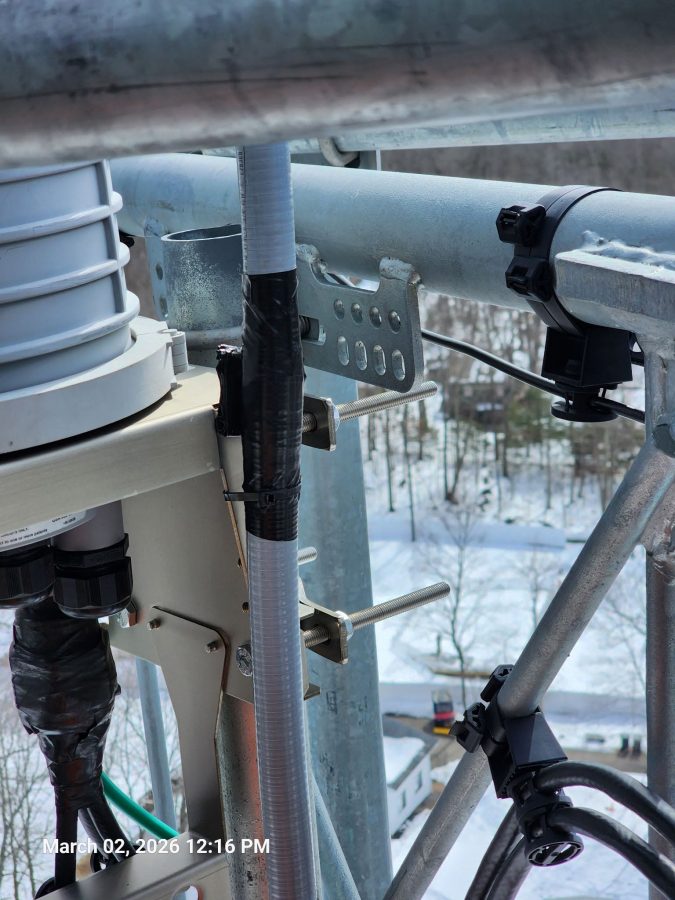
Slatercom LED light system controller
What is interesting is, that the original wiring and photocell failed at some point, and someone simply wired up a new photocell, leaving all of the old equipment in place. Thus, it became difficult to troubleshoot and ID the conductors in use vs the ones abandoned. With the replacement of the tower light systems, I decided that everything must go. The new Slatercom A-1 replacement lighting systems have individual controllers each with its own photocell. In addition, they have wireless links for tower light monitoring. It is great to get rid of the dry pairs going back to the transmitter room, which always creates RF and lightning headaches.
The station will also be saving some money on electricity. The new lighting system draws 88 watts total vs the old incandescent system which drew 1,000 watts with a 50% duty cycle on the beacons. The old system was on all the time due to photocell failure. I estimate they used 17,520 KWh per year on tower lights, at $0.20 per KWh which is $3,504.00 per year vs $308.00 per year for the LED systems. The added benefit of LED fixtures is that they should last much, much longer than incandescent fixtures.
WBEC-FM Harris FM1H3 transmitter scrapped
This lovely Harris FM1H3 was donated to the scrap yard. I believe that this is the second transmitter (1974) for the original 105.3 WBEC-FM which signed on in 1967.
Tower #1 ATU building cleaned out
The building clean-out, unwiring, and rewiring process took about a day and was well spent, in my opinion. Working in a building that is not full of mouse nests, droppings, and stinks like mouse urine is nice. I plugged several holes in the building with stainless steel pot scrubbers and spray foam.
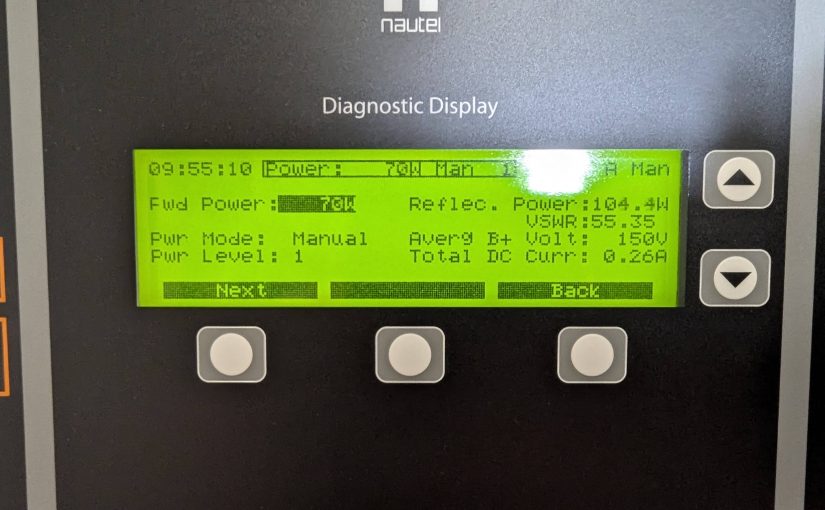
Nautel Amphet 1 transmitter
After removing and replacing the old tower lighting system, the Nautel Amphet 1 transmitter would not run into the nighttime array. This was likely due to the changes at the tower base. I used a VNA to measure each tower’s base impedance which is 42.5 ohms and -j139, 44.5 ohms -j155 respectively.
WBEC Tower #1 base impedanceWBEC Tower #2 Base Impedance
Then the daytime and nighttime common point impedance was measured. Both were off, but the nighttime was more so than the daytime. I adjusted the R and X until both were reasonable and the transmitter would run into both patterns. According to Nautel, the Amphet 1 transmitter runs best into a load of 50 ohms j+5 measured at the transmitter output.
WBEC antenna system schematic
The daytime antenna is non-directional and there is no “common point,” however, there is an R and X adjustment in the phasor for the daytime tower. According to the file I found, it used to be a directional daytime until 1967, when they could make the daytime antenna non-directional. It is an interesting setup.
With the array properly adjusted, readings could be made along the monitor point radials. This station has three monitor points, two are in the nulls and one is in the main lobe. It is the nulls that are the greatest concern. Fortunately, much of the documentation from the original proofs was found in a filing cabinet. While the maps are nice, they date from 1950 and are woefully out of date. However, I was able to find good reference points on the 1950 maps and redraw radials on a Google map.
I found these photos of the monitor points as they were in 1956:
1956 photographs of an engineer making field strength measurements
Those were great because I was able to verify the locations of the monitor points today:
243-degree radial monitor point, 2024
Based on that, I made three maps with radials on the monitor point azimuths:
WBEC-AM Pittsfield, MA 243-degree radial ten measurements
The consulting engineer wanted about 10 readings on each radial. I created an individual map for each radial, marking points where the radial crosses a public road. When it came time to do the monitor points, I loaded the map into my smartphone and followed the directions to each point. It worked very well.
We will return and make post-installation measurements once the new FM antenna is installed.
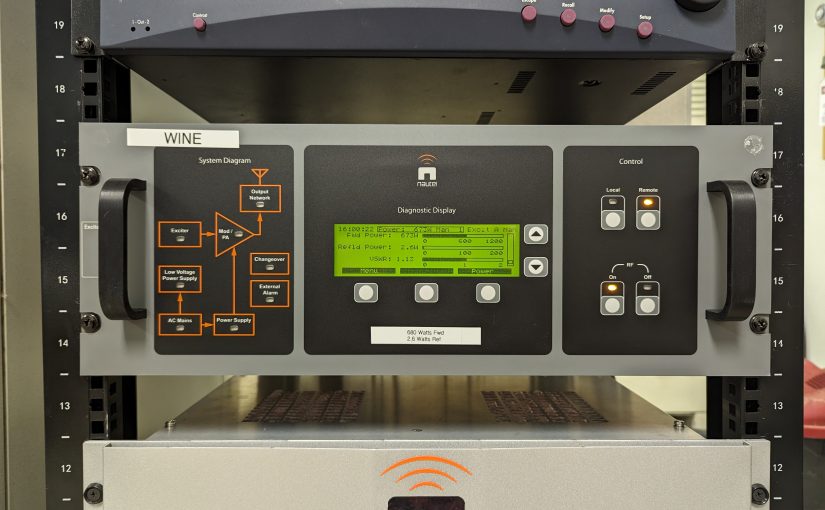
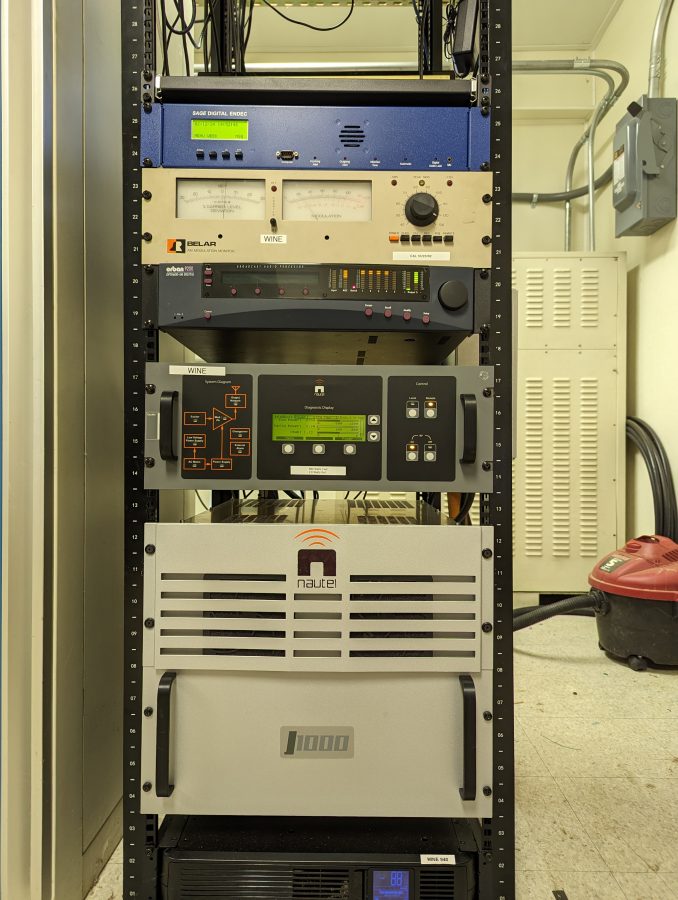
I Finished up this installation of a J-1000 in Brookfield, Connecticut for Nossa Radio. That is a Portuguese broadcaster that owns three other stations in the US.
WINE 940 KHz Brookfield, CT
These Nautels are fairly simple affairs; a controller and two RF amps with incumbent power supplies.
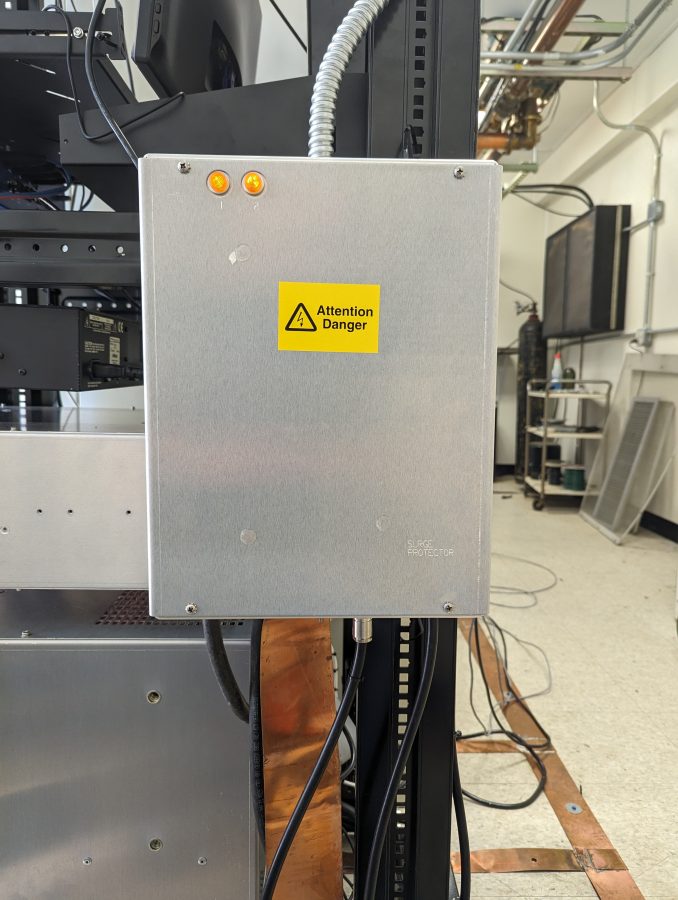
Nautel AM-RF and AC mains surge suppressor
Be sure to install the surge suppressor that comes with the transmitter.
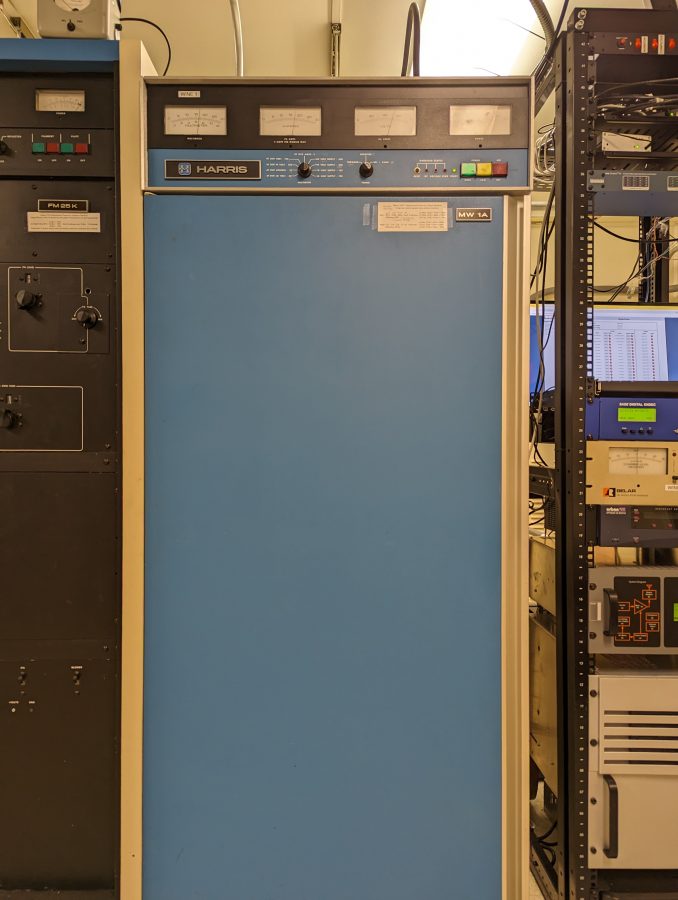
The J-1000 is replacing the 43-year-old Harris MW-1A which will function as a backup. Like all new transmitter installations; some things must be done to complete the job.
Harris MW1A
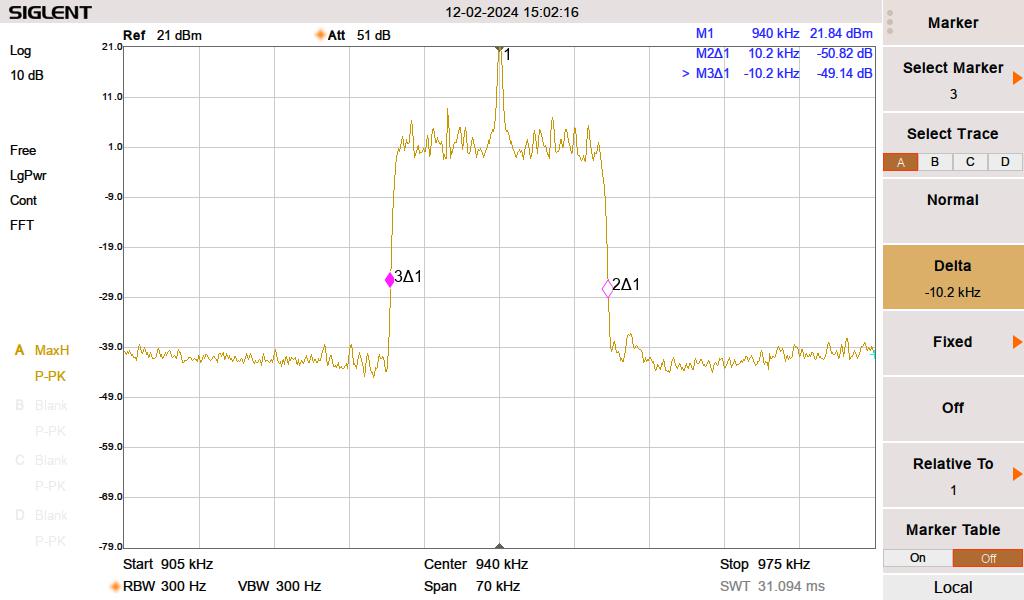
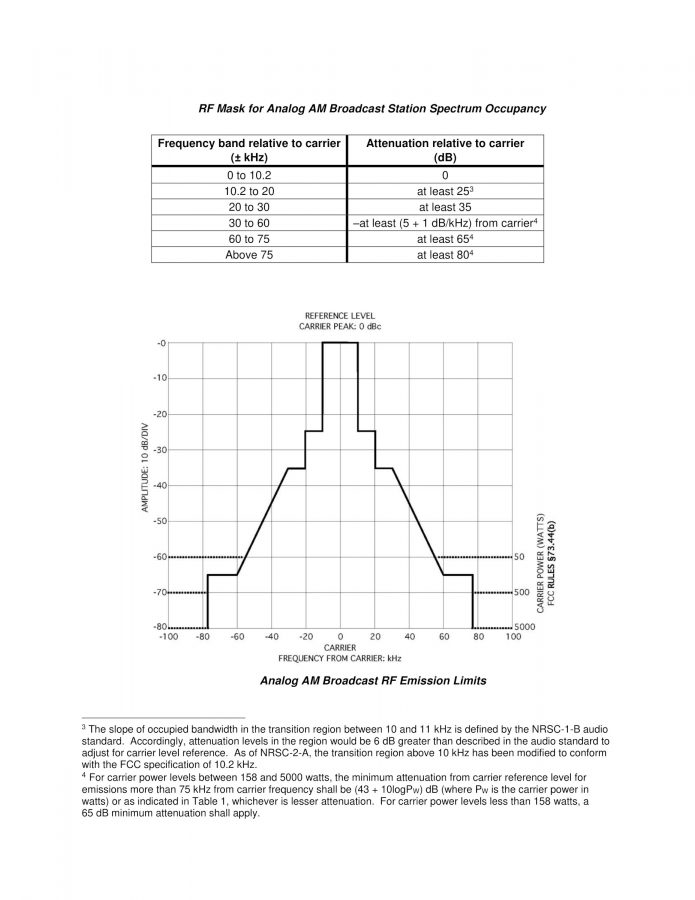
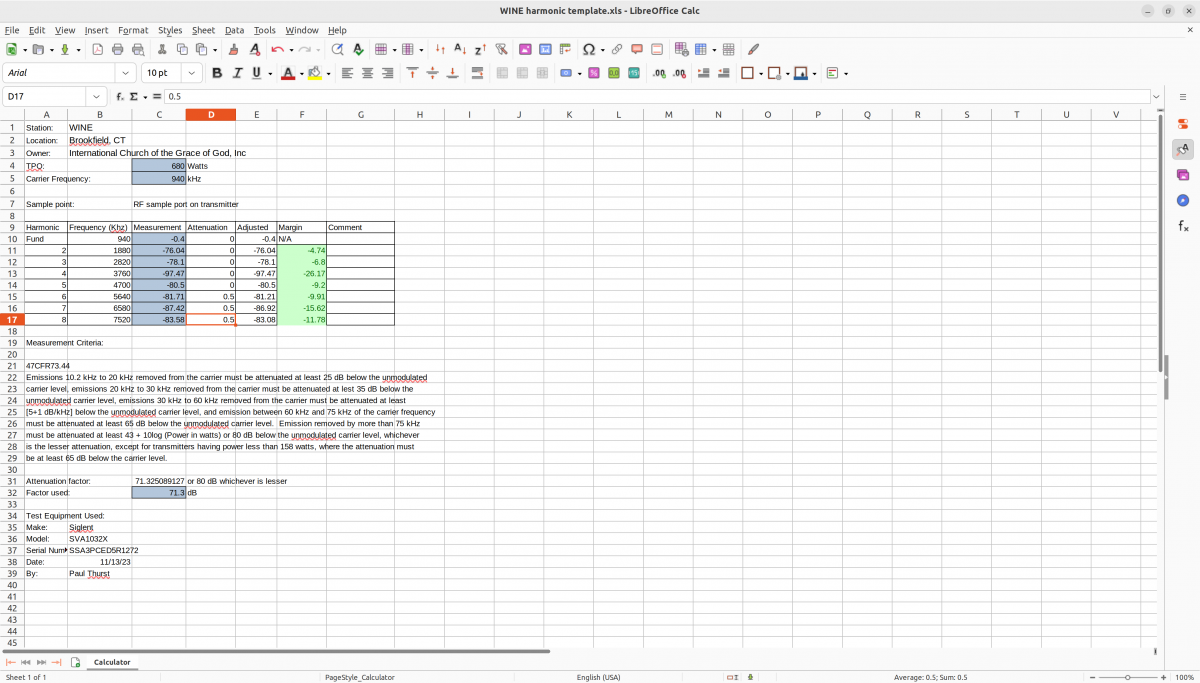
Harmonic measurements out to about the 5th or 6th harmonic need to be documented and compliant with NRSC-2 (AM mask requirements). Although NRSC-2 measurements are required, I don’t see how they can enforce that specification after AM HD radio came into being. Nevertheless, it was measured and passed. With the station carrier power of 680 watts, I used the RF monitor port on the back of the transmitter to make the measurement. Otherwise, I would need to find an empty field somewhere 1 KM away and stand in the middle of it to reduce all of the electrical noise.
Spectrum Mask from a Spectrum Analyzer
The NRSC-2 mask is mainly a function of High-Frequency limitation in the audio processor—certain transmitters, like the aforementioned MW1A did make some contributions to out-of-tolerance measurements.
NRSC-2C AM mask requirementsHarmonics measurementsWINE folded unipole feed point
The antenna is a skirted tower that has many other services colocated on it. At the top is WRKI.
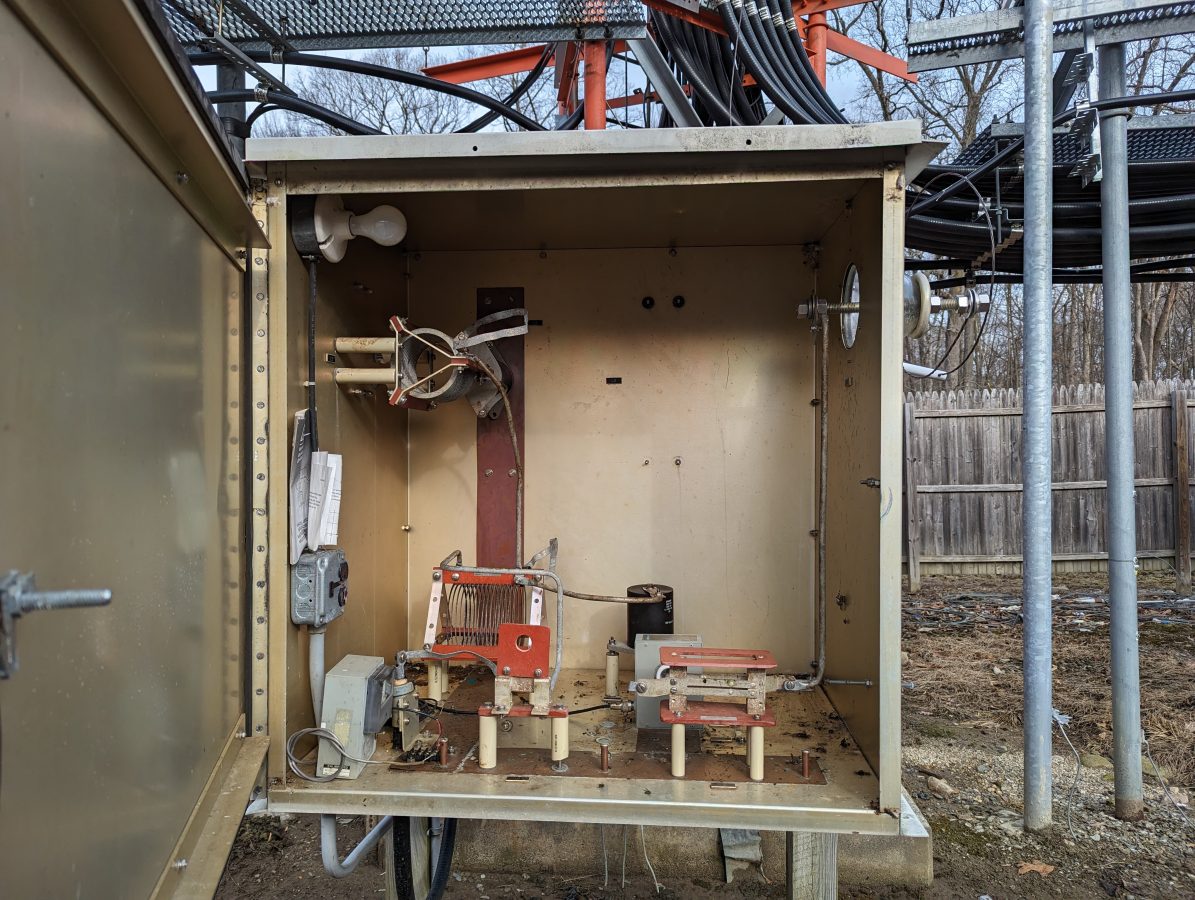
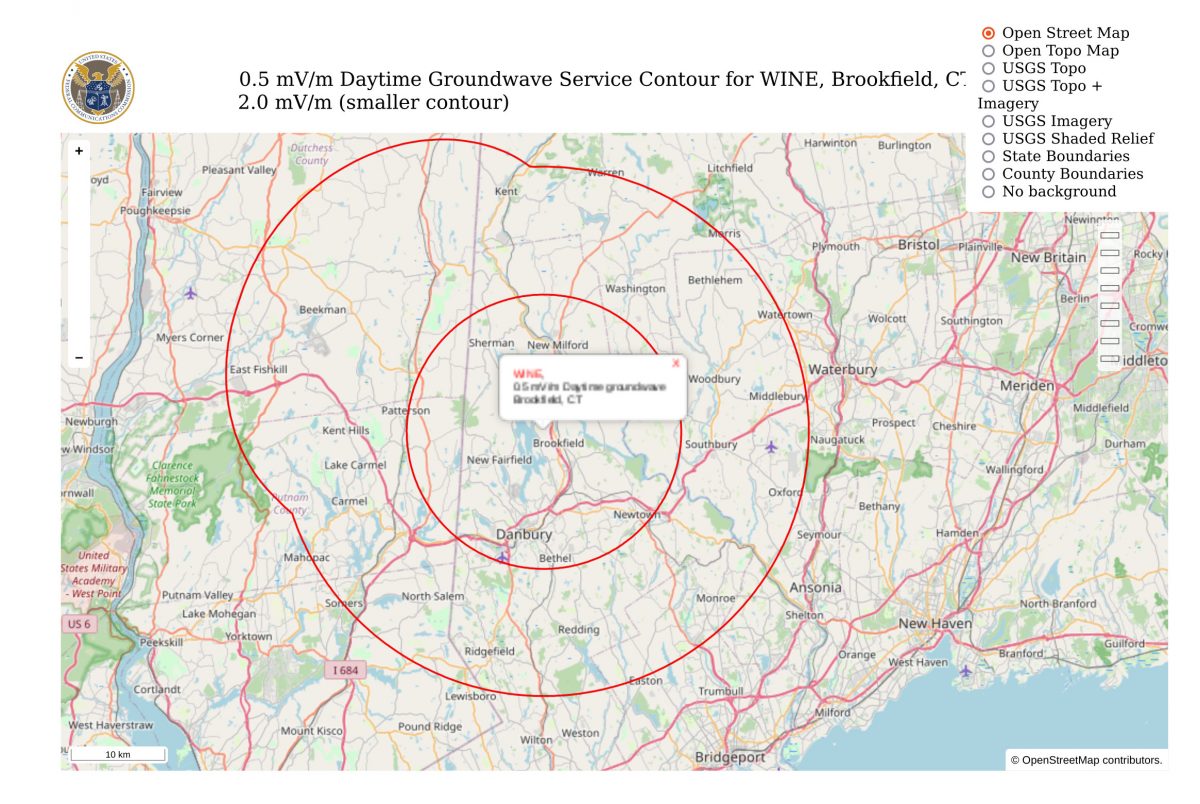
WINE ATUWINE daytime coverage map
Driving away from this site, I would have to agree with the predicted contour map above, at least on the highway. I think it may be a bit different driving around in town.