I saw this at the WIZN transmitter site in Charlotte, VT:

Somebody went through quite a bit of trouble to chart the transmitter readings from April of 1987 through about February of 1992.
A closer view:
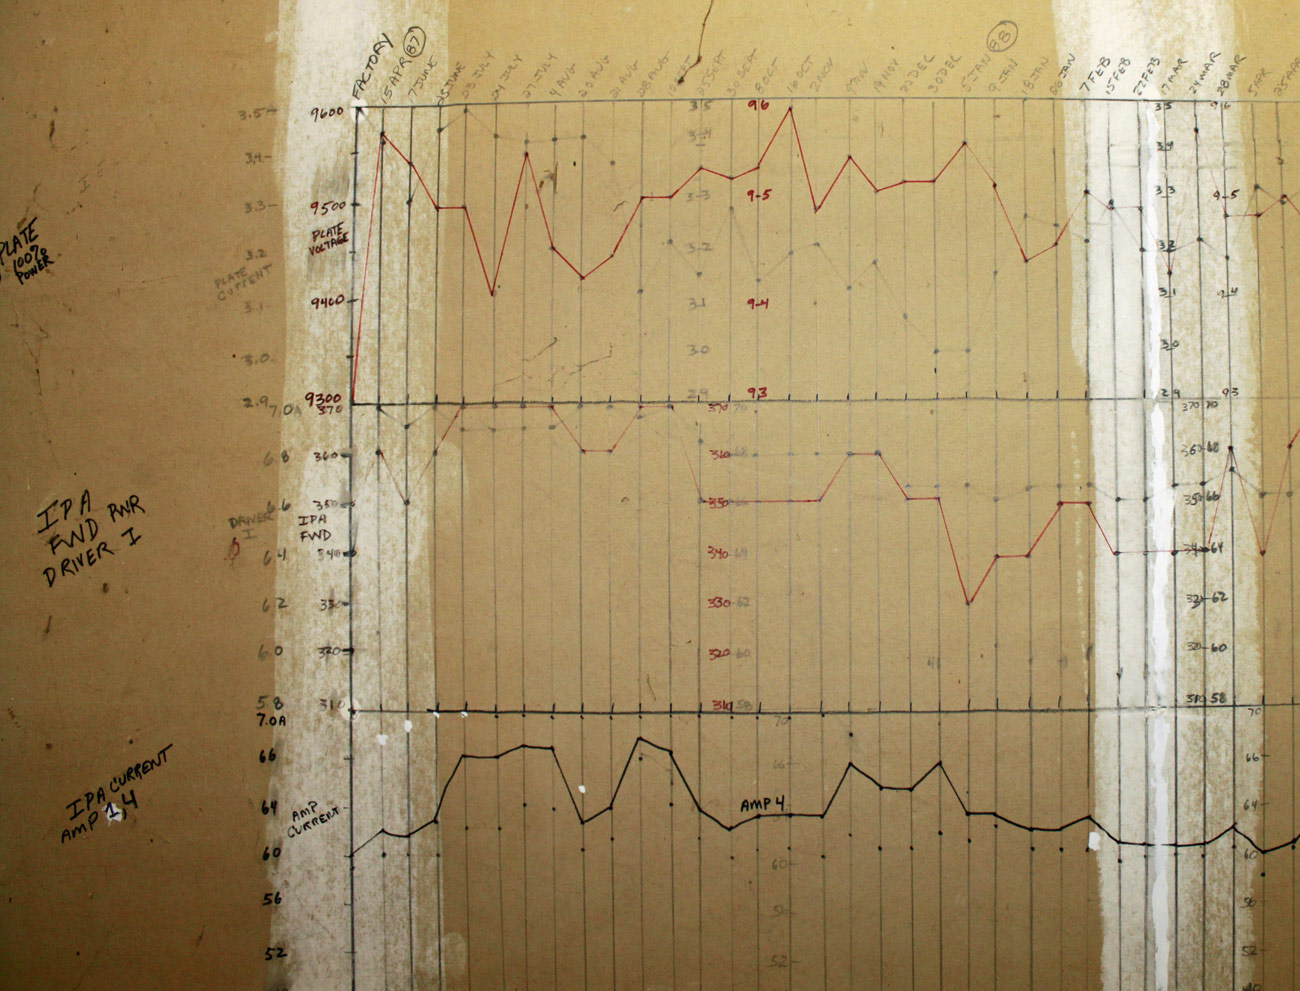
I have not seen this at any other transmitter site, so I thought it was an interesting way to keep a transmitter log. It also seems to be time-consuming and a bit obsessive. Over the years, I have found my fellow broadcast engineers to be a somewhat strange group sometimes.

I often wish there were an app for the iPhone that would let you enter readings, store them in the cloud, and access them via a website with graphs like the ones on the wall.
Interesting, thanks for sharing. Jon, use google docs spreadsheets. Works great for syncing, sharing & graphs.
I have kept the readings for my various tube transmitters on a spreadsheet with each transmitter as a column on my phone. The spreadsheet also has the PA effy. formula for each transmitter in it, so all I do is enter the Epa and the Ipa and get the reading. This spreadsheet is kept on my Dropbox folder. Perhaps someone can make up a spreadsheet like that with graph display? I did do a graph one time on a troublesome transmitter so I could learn the relationships between the voltages and currents of the drivers and final. It was very enlightening. Thanks for posting all this Paul. Very good information and interesting.
The idea of an excel spread sheet stored in google drive sounds pretty interesting to me. Especially as the spread sheet can be formatted to give PA efficiency, mean and min/max for any particular reading. One can also make x/y scatter graphs, but those may be hard to display on a smart phone. Perhaps I will work up a template and post, as I find the time to do such things…
Well providing one has wall space to do such activity…it is rather interesting. I’ve been doing all my logs on spreadsheets for a long time but never thought about storing them on the cloud for reference. I do use my cell phone a lot at the sites though, I take readings and then snap pics of the metering for reference or if I just don’t have a lot of time to take readings on site. Maybe sounds redundant but it’s quick and easy to keep and maintain.
Mark
I remember seeing a book somewhere, an early boy’s or man’s introduction to electronics from an era when most houses didn’t have electricity. There was an experiment that had the reader suspend a mirror attached to a magnet from a small rope, thread, or hair and in the proximity of a coil or loop of wire. A candle or flashlight was placed nearby. As the mirror would turn, the light would trace on the wall, mapping out the audio waves. Yes, in 1901 or 1910, they had mechanical oscilloscopes.
I know why he wrote it on the wall — he had a wall to write on and didn’t need the information down the hill. 😉 Or he just started it as a baseline and kept it running.
The modern way is with a round-robin database (RRD) but RRD throws data away as part of the aging process.